The GPS receiver would be pretty useless if it did not provide any output and since this one is designed to be used for both Educational and Research purposes it outputs more than just the standard position and velocity data. It does not currently use NMEA format for this, but uses a simple ASCII text string, NMEA message formatting code is available as the OSGPS open source project outputs NMEA format messages.
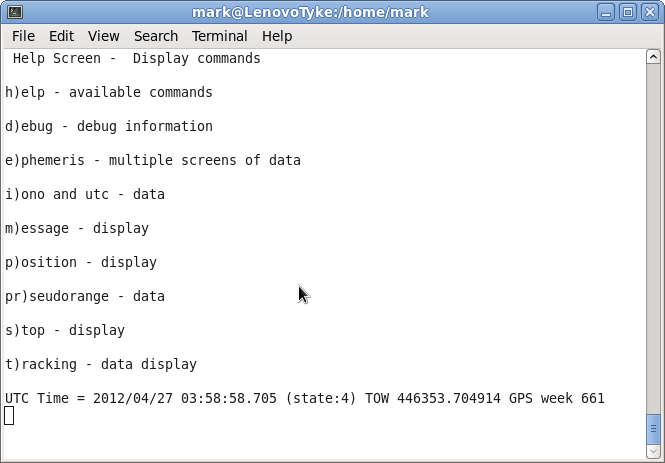
Perhaps the most important display screen is the help screen, this is the default screen on startup and lists the options available to show different information.
Actually I should probably mention that the data is output at 56kbps baud rate using 8 bits no parity format, this can be changed if desired but currently needs to be done in the firmware.
This is output on serial channel 2 of the GPS600 device.

This is the screen displayed on startup after UART2 has been selected, the logging screen is on UART1 so commands can be sent to start logging without the need to manually change the UART select switch.
The main display help screen shows the display options available and the one letter commands used to select the various display modes
Most of these commands are described in detail lower down this page ,but for the debug and stop commands this is not neccessary.
The debug display shows the amount of stack space used by each of the threads and the Stop command causes the current display to stop automatically updating

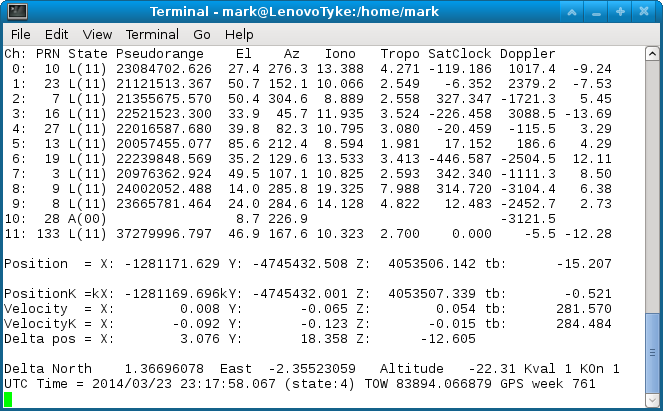
This is probably the screen of most initial interest and so it is where I will start. At the top of the screen are the various states of the 12 tracking channels of the device. Starting with channel number, Satellite PRN number, Channel Status, Measured Pseudorange, Satellite relative position, followed by the Pseudorange corrections and finally the calculated doppler.
At the bottom is calculated position information x, y, z axes and clock offset in metres, followed by velocity in the x, y ,z axes and delta clock offset, which is related to the tcxo offset.
Then Latitude(degs,mins,secs), Longitude(degs,mins,secs) and Altitude (m). Latitude(degs),Longitude(degs) and Altitude(ft).
The Tracking display shows the status of the tracking function of the 12 channels of the receiver. The 1st column is the receiver channel, then we have the PRN of the satellite assigned to that channel. The 3rd column is the number of misses that have occured in the measurement interrupt DSR
The 4-7th columns show the cross correlation values read from the receiver hardware for In-Phase and Quadrature channels of the prompt and early-late hardware correlators.
The 8th column starts with the tracking channel status character, A=Acquisition mode,C=Confirm Mode,F=Frequency Locked Loop,P=Phase Locked Loop and L=Frame Locked.Next is the Bit lock or Code tracking bit, set to B if the channel is bit locked other wise it shows the width of the Code PLL(A=Acquisition,T=Track,L=Lock).Finally the Frame Lock or Frequency tracking bit.
Followed by the Code Offset from 1-2046, the Signal Strength(512 is the noise floor) and the Phase Offset 1-2048).
Then lastly there are the average phase and code errors ending with the bit value of the last 20 correlations 0/1 for -/+ correlation values.

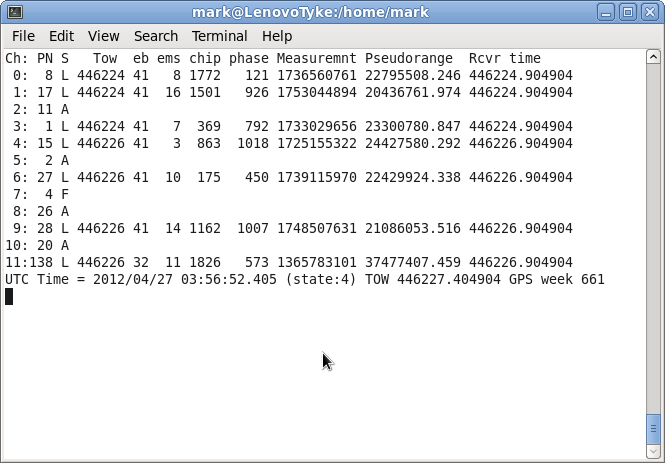
The Pseudorange display screen shows the measured pseudorange and the components that are used to calculate the pseudorange. As usual it starts with the Receiver Channel and the Satellite PRN, followed by the tracking status. Then we have the current TOW or TimeOfWeek of the Satellite being tracked, this is the value transmitted in the first word of the current frame and represents the time in seconds since midnight GMT on Sunday Morning (well almost GMT).
The second set of 4 columns are the values read from the internal hardware rgisters of the GP4020 chip when the measurement interrupt is running.These are the point in time values of the satellite signal when the measurement interrupt is triggered. See GP4020 manual for more details. The first column is the data bit no, there are 50 of the 20ms data bits in each second, next is the signal correlation bit, ignoring doppler effects, the prn code is brodcast every millisecond so there are 20 of these per data bit. After this we have the code chip or prn sequence bit times 2, because the device is clocked at twice the actual PRN bit frequency, instead of 1-1023 this then ranges from 0-2045.The last of these 4 values is the phase of the code chip and this ranges from 0-1024.
Next we have the measurement which is the time of the signal calculated by adding the contributions of the previous 4 columns. This represents the satellite time when the signal at the measurement interrupt was transmitted by the satellite.Now we have the pseudorange which is the difference between the measured satellite signal time plus the satellite time of the week in seconds minus the Receiver time saved when the measurement was taken.

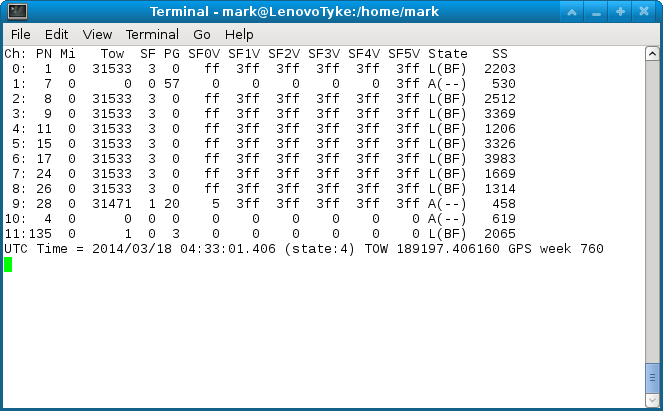
The Message display shows the collection and validation of the 5 frames and 10 words per frame that make up the Navstar Navigation message structure. The TOW shown here is the actual value received in the message, which consists of the 17 most significant bits of the 19 bit TOW-count, before it has been multiplied by 6 to show the TOW in seconds.
Next we have the subframe that is being processed, this is in the 2nd word of the subframe and the latest page number for subrames 4 and 5. This is followed by the parity check bits for current subframe being processed. The parity check bit is 1 for pass and 0 for fail, the bit for the 1st word is in bit 0, with the bit for the 10th word being in bit 9, hexadecimal value 3ff indicates all 10 words have passed the parity check. If all the words in the subframe pass parity check the subframe is saved to it's own location. Subframes are stored in an array indexed from 0-5 with 0 being used for the subframe currently being received, once a valid subframe is received it is moved to the correct slot for further processing. The last column is the Signal Strength measured by the correllator hardware.

The Ephemeris display consists of 6 sub-screens that show the values of all the fields that are transmitted as part of the Ephemeris message. Every time 'e' is entered the next sub-screen is displayed until the last one is reached at which point it starts from the beginnning.
The headers in the various ephemeris sub-screens use the same names as those found in the NATO stanag doc that describes the message format and signal structure of the Navstar system.